Multiple Series / Multiple Facts
When creating a chart, you can compare key measures or facts against another. To enable multi-series charts, simply drag a field from the left-side menu to add it alongside the key measure or fact.
For multi-series charts (multiple key measures), the available options include:
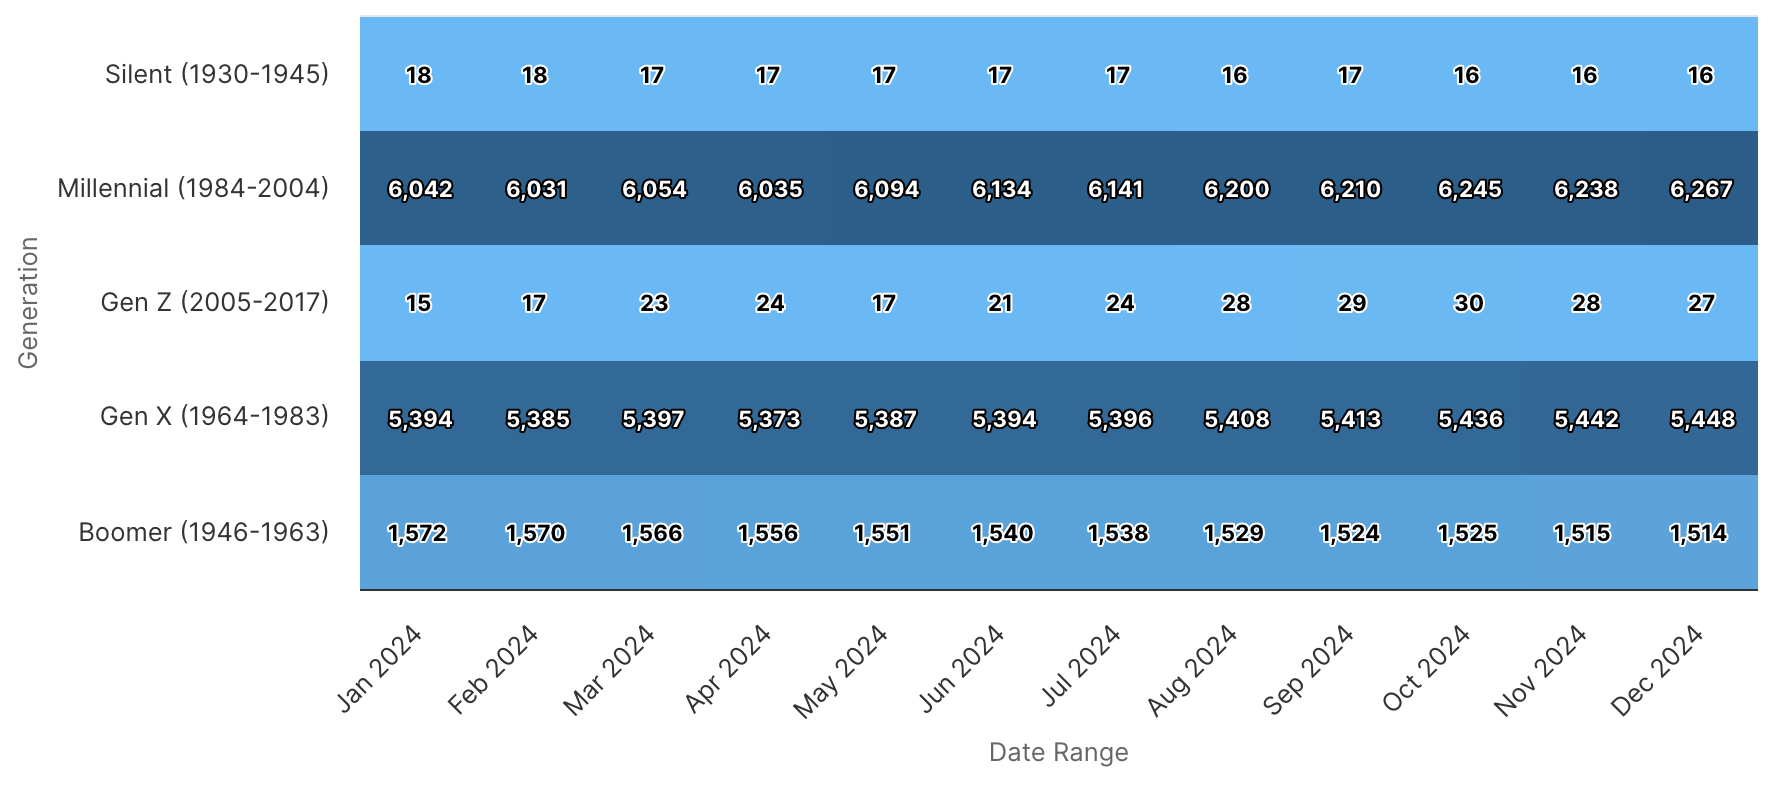
Heat Map
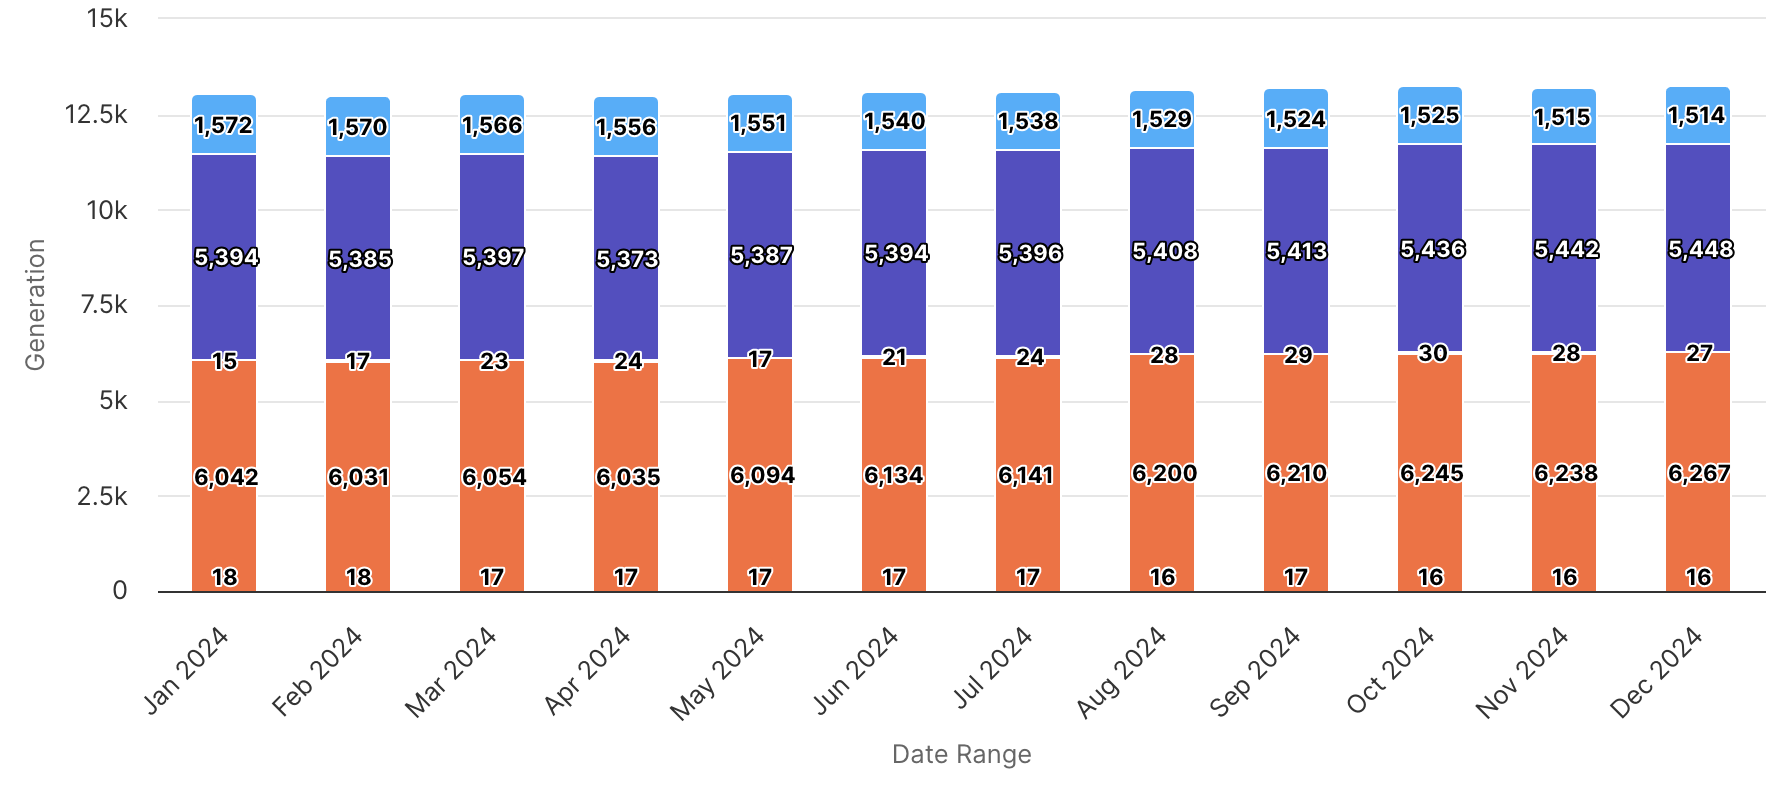
Stacked Column
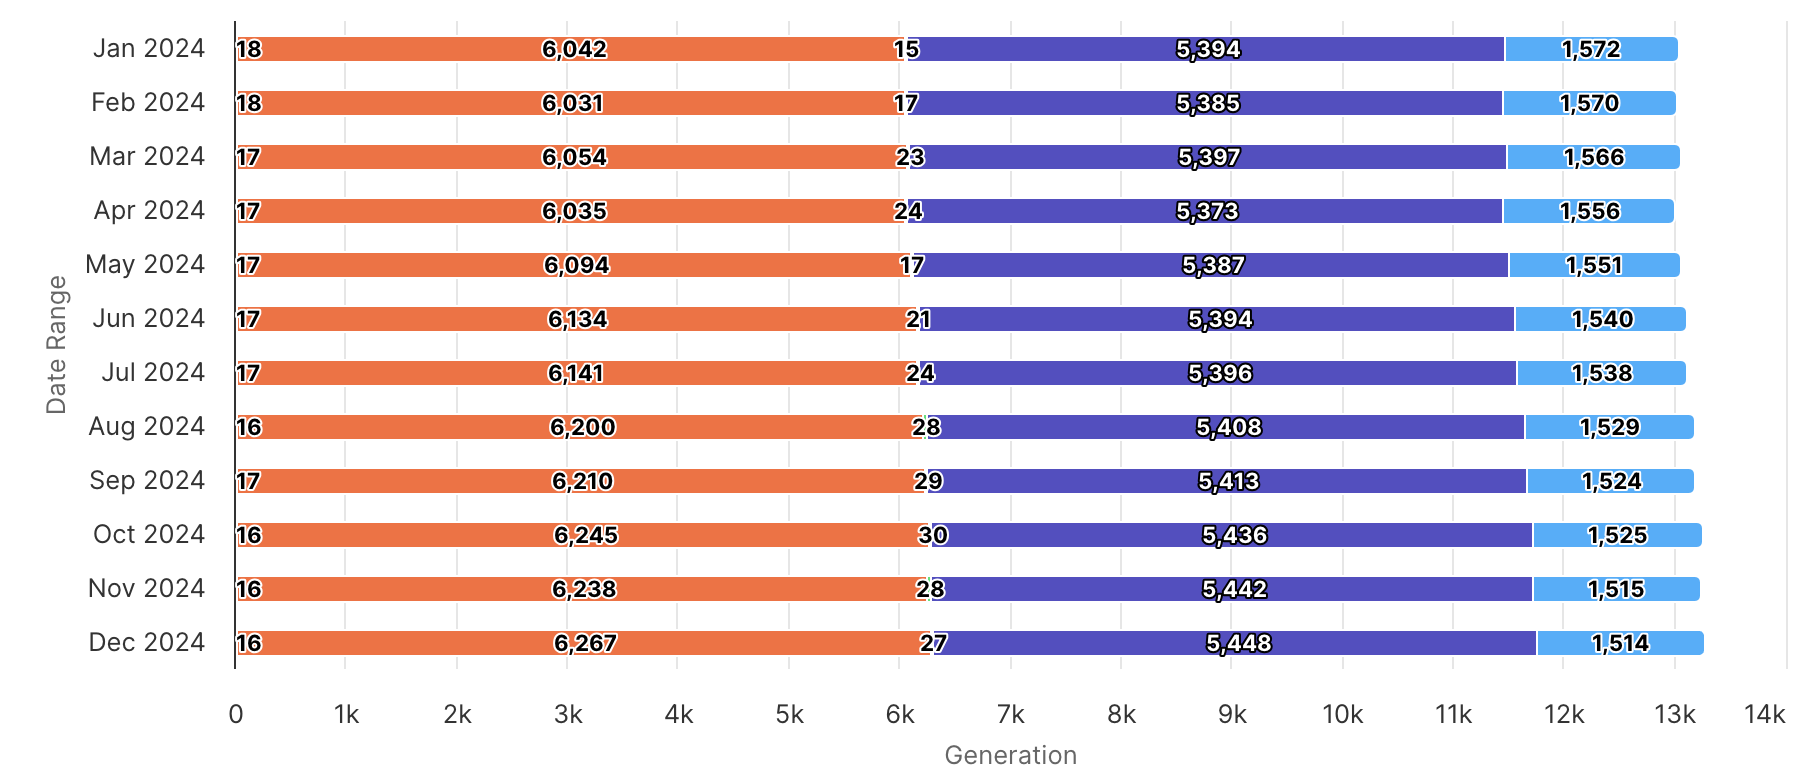
Stacked Bar
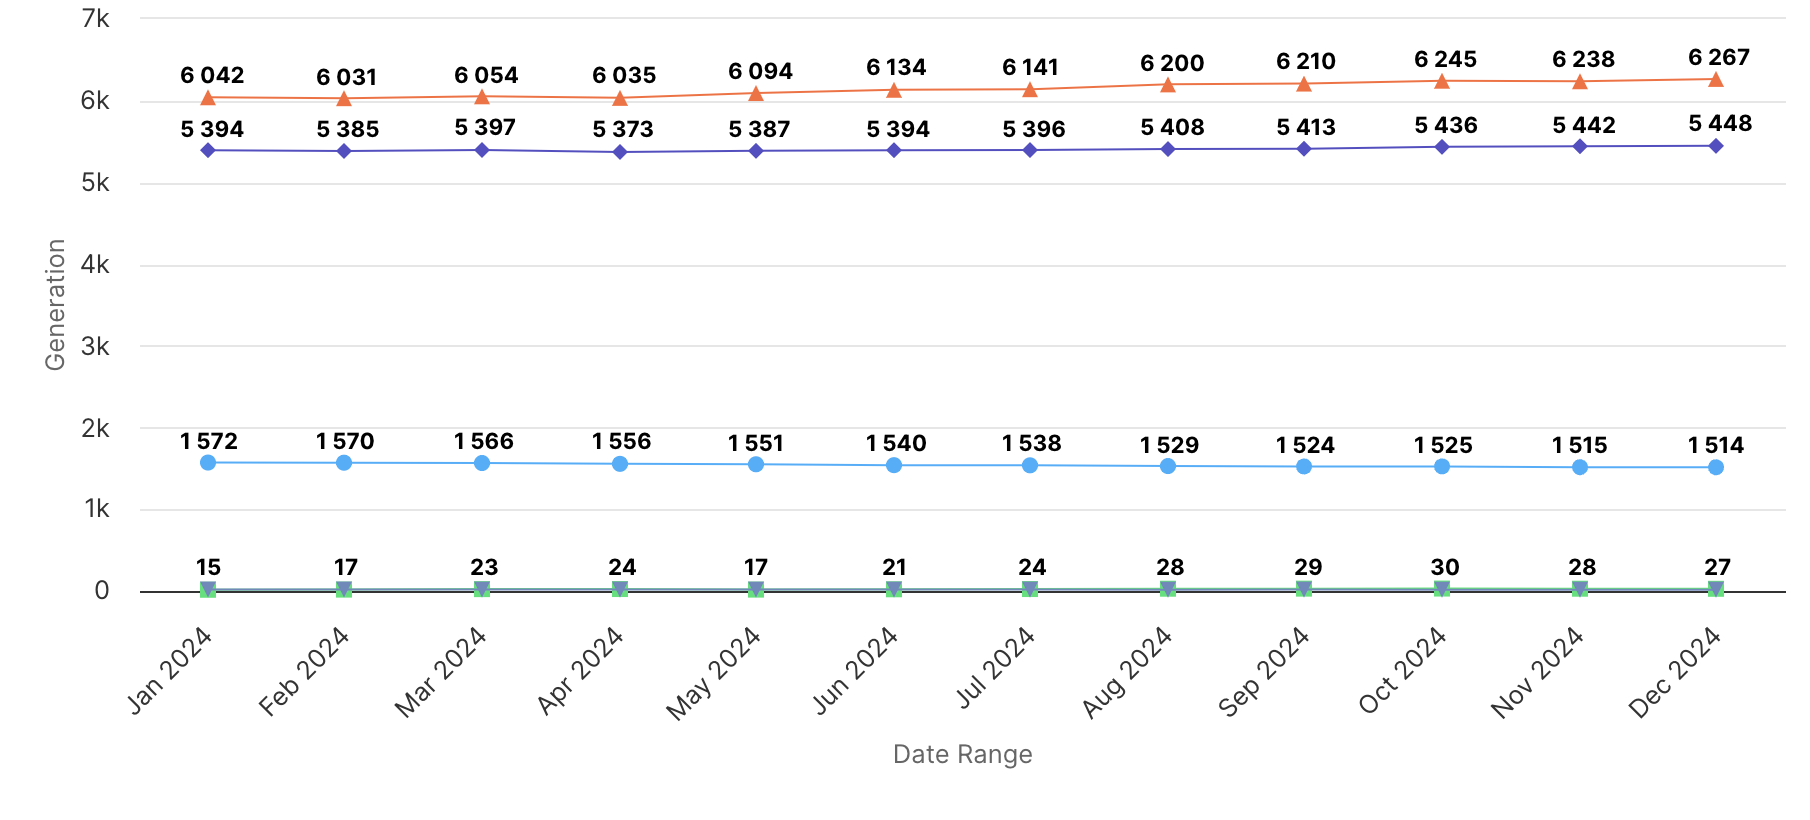
Clustered Line
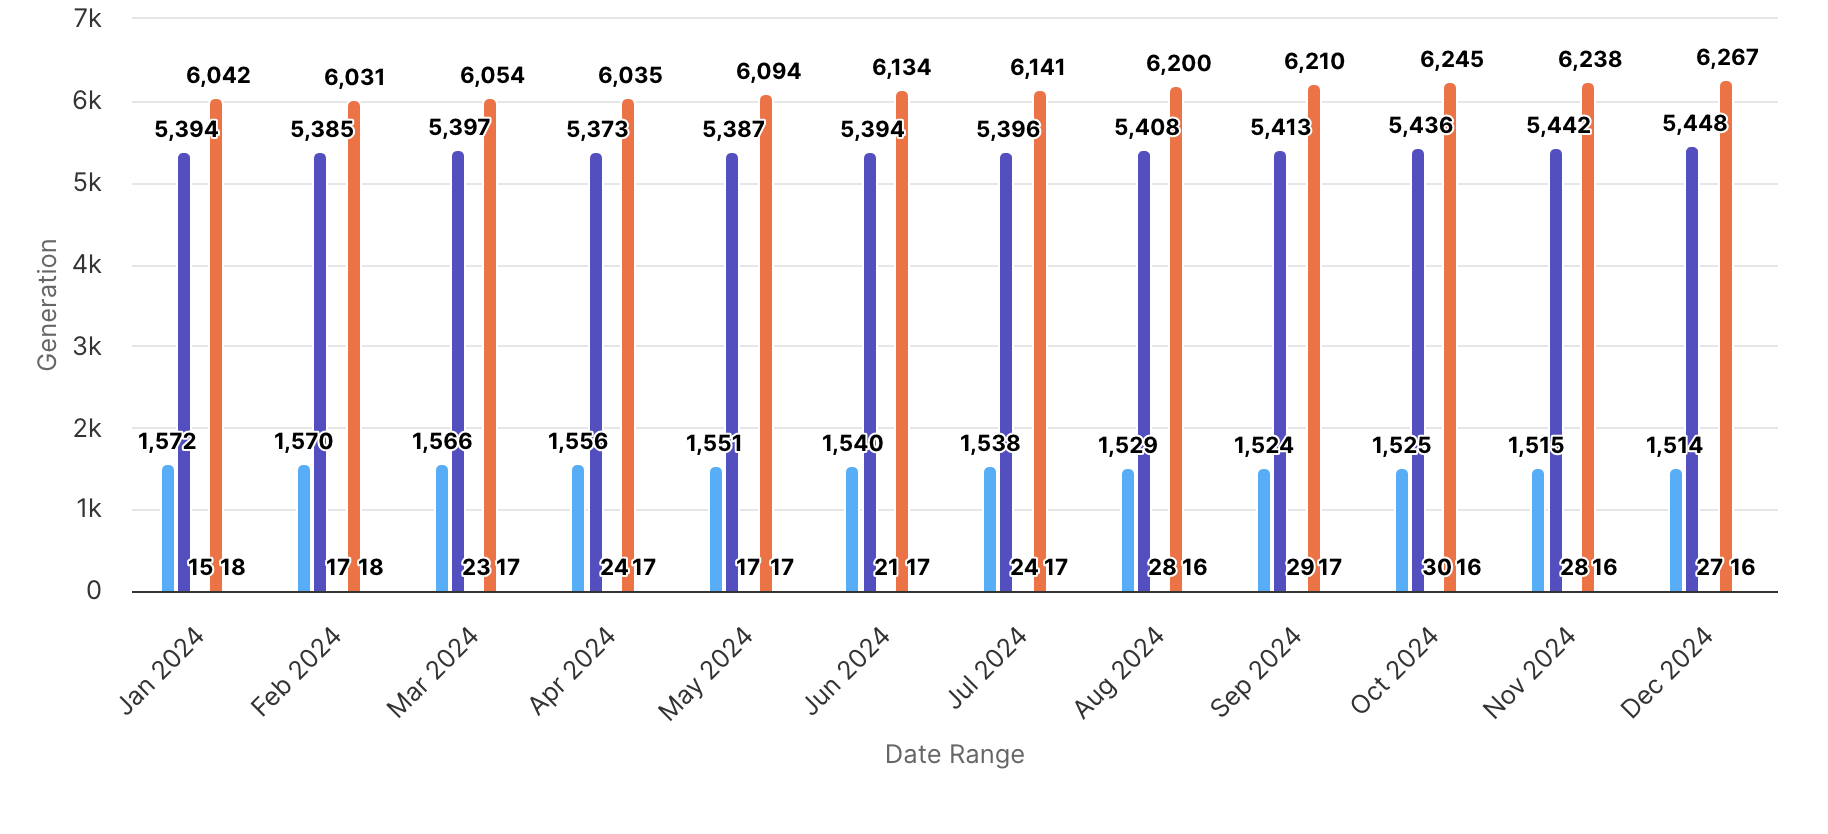
Clustered Column
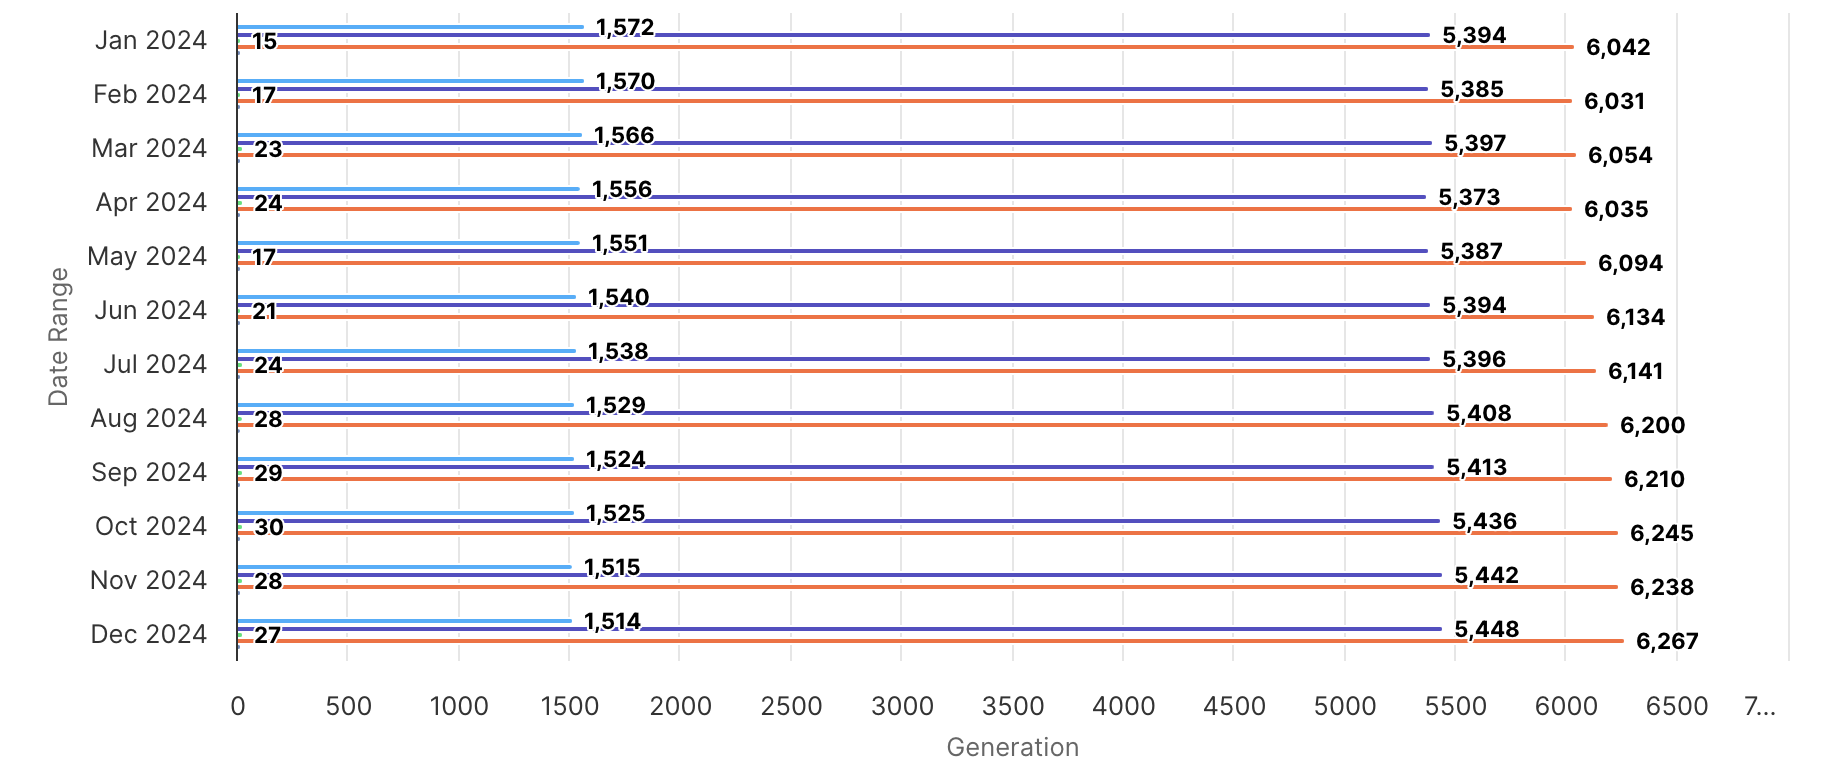
Clustered Bar
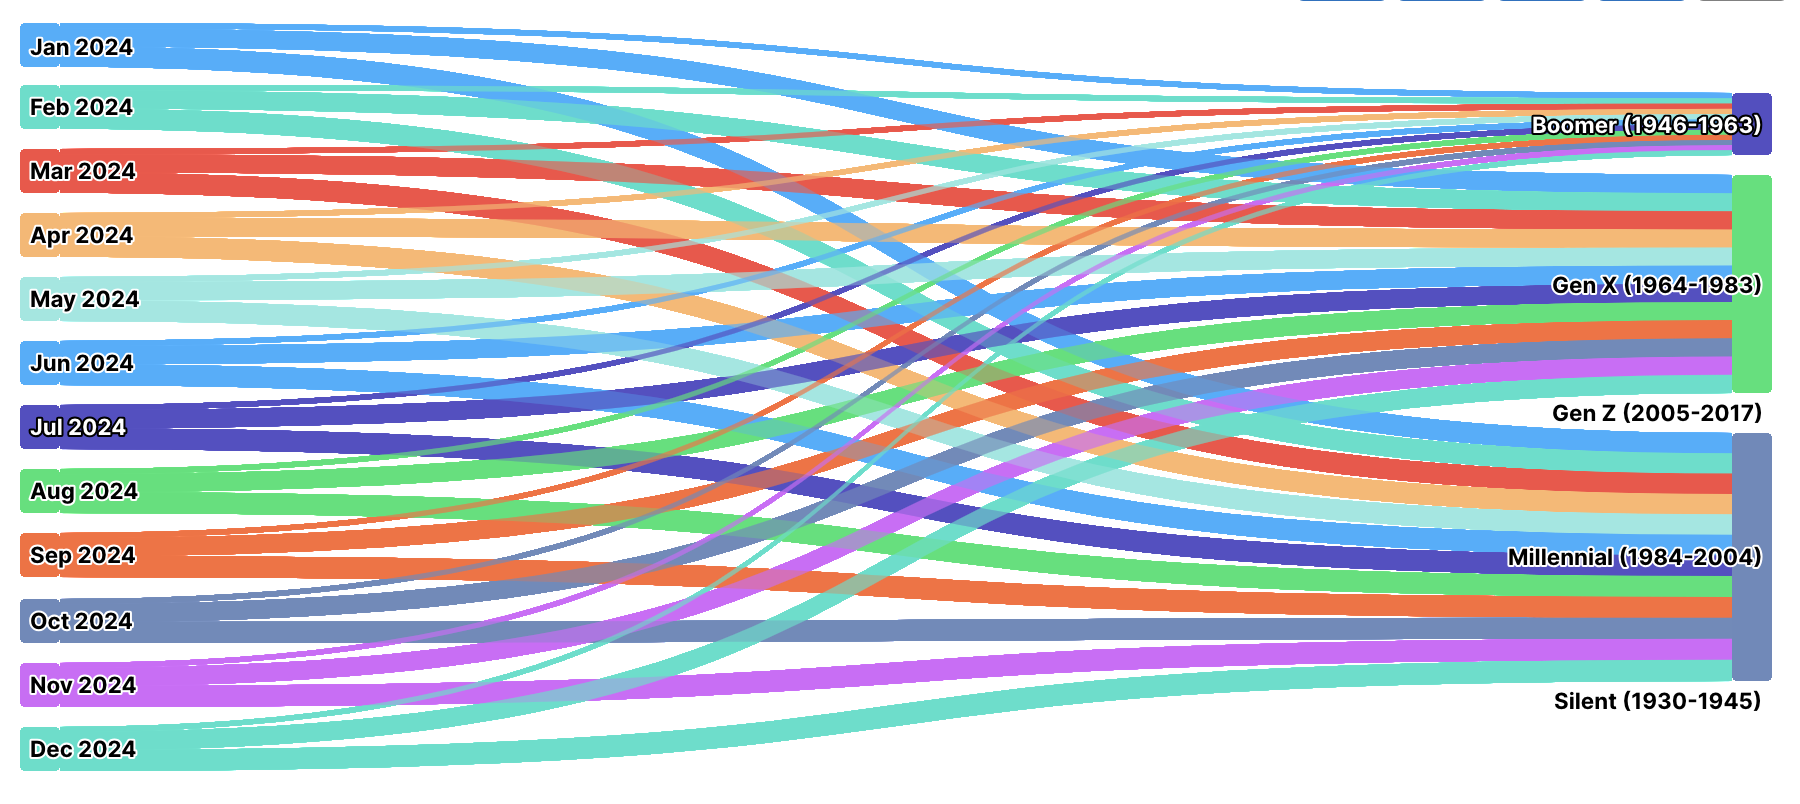
Sankey Diagram
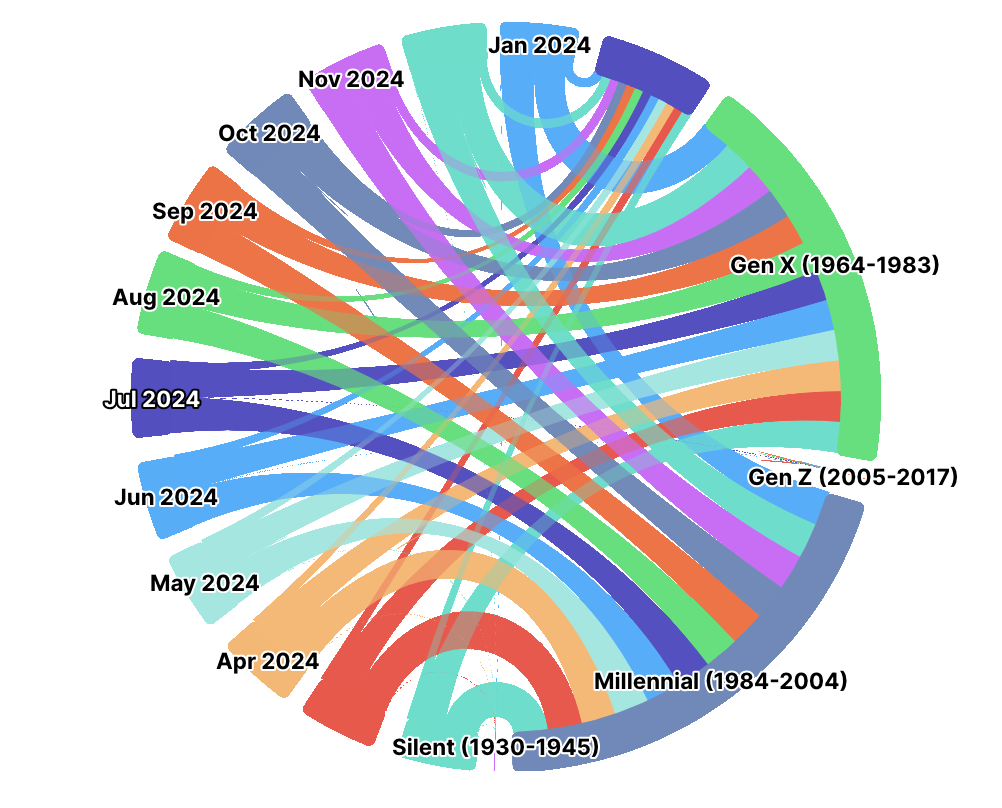
Dependency Wheel
Treemap Stripes
No Comments