Chart Types
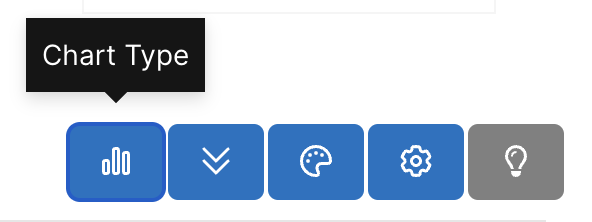
When creating charts in ZeroedIn, you can choose from a variety of chart types based on the chart’s content. To select or edit a chart type, click the Chart Type icon to open a menu displaying the available options.
The options depend on the number of series in use:
• Single Series Charts: These are based on a single key measure or fact.
• Multi-Series Charts: These become available when comparing one key measure or fact against another. To enable multi-series charts, drag a field from the left-side menu to compare it with the key measure or fact.

For single-series charts (one key measure), the available options include:
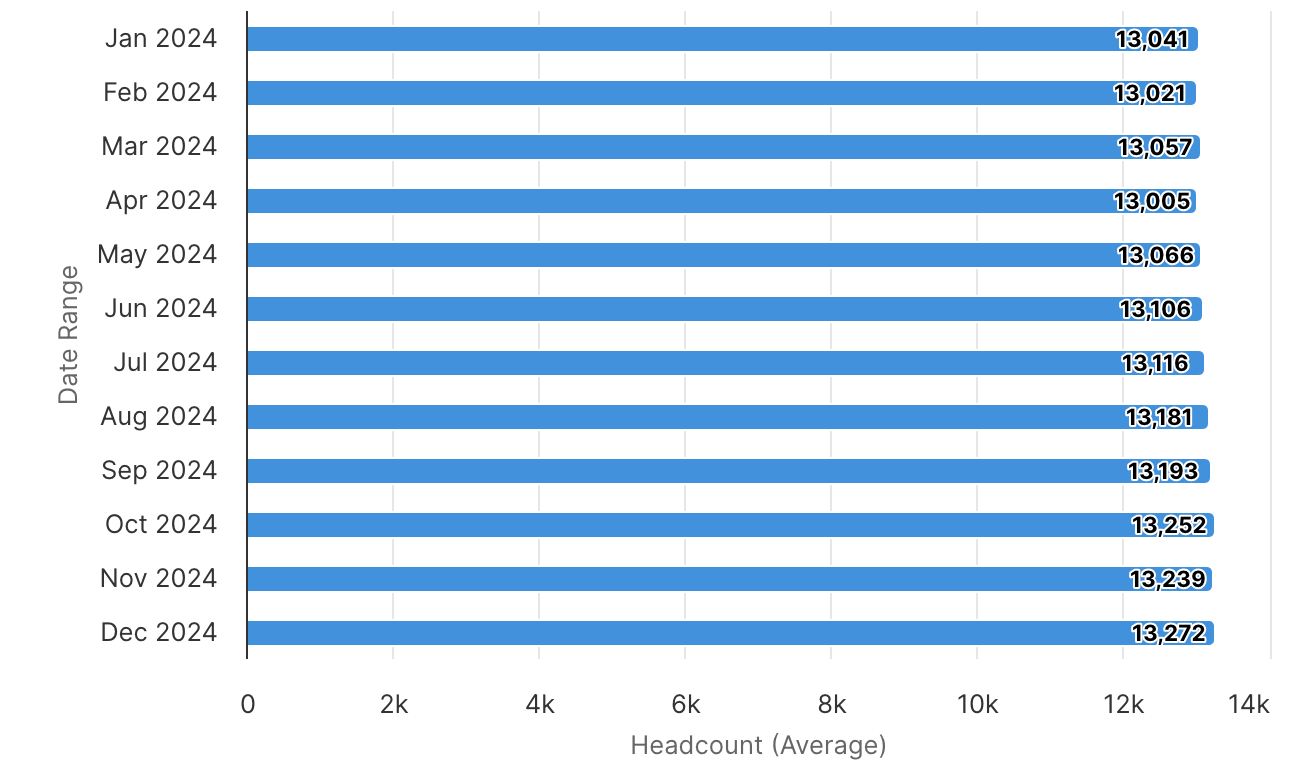
Horizontal Bar
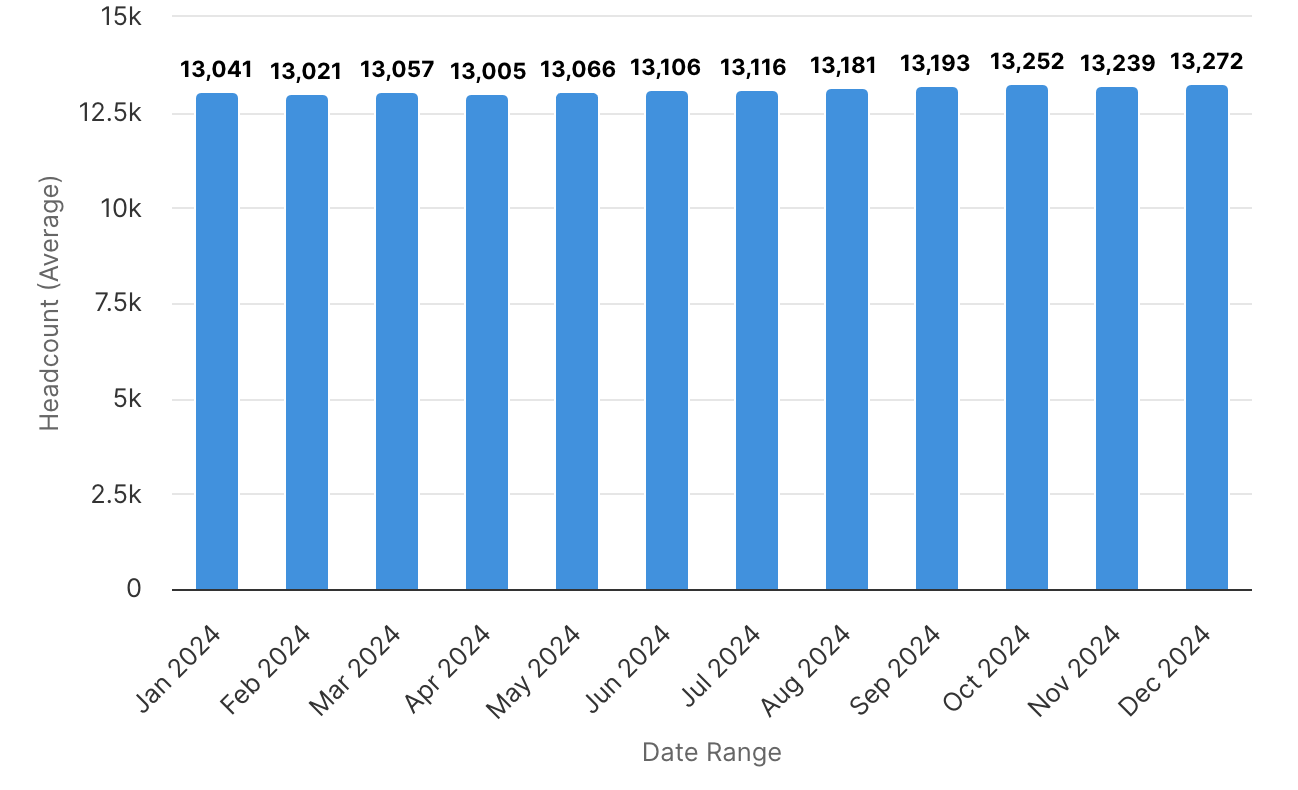
Vertical Bar
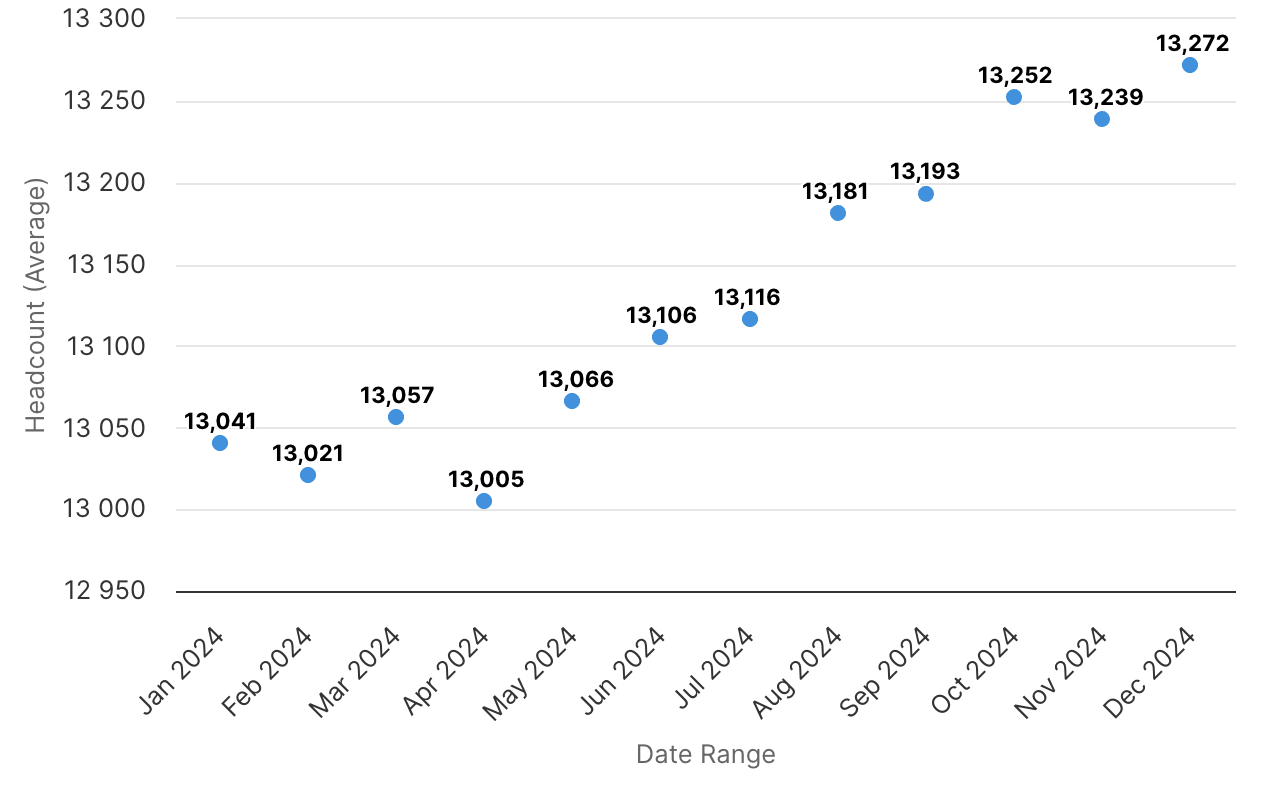
Scatter Plot
Word Cloud
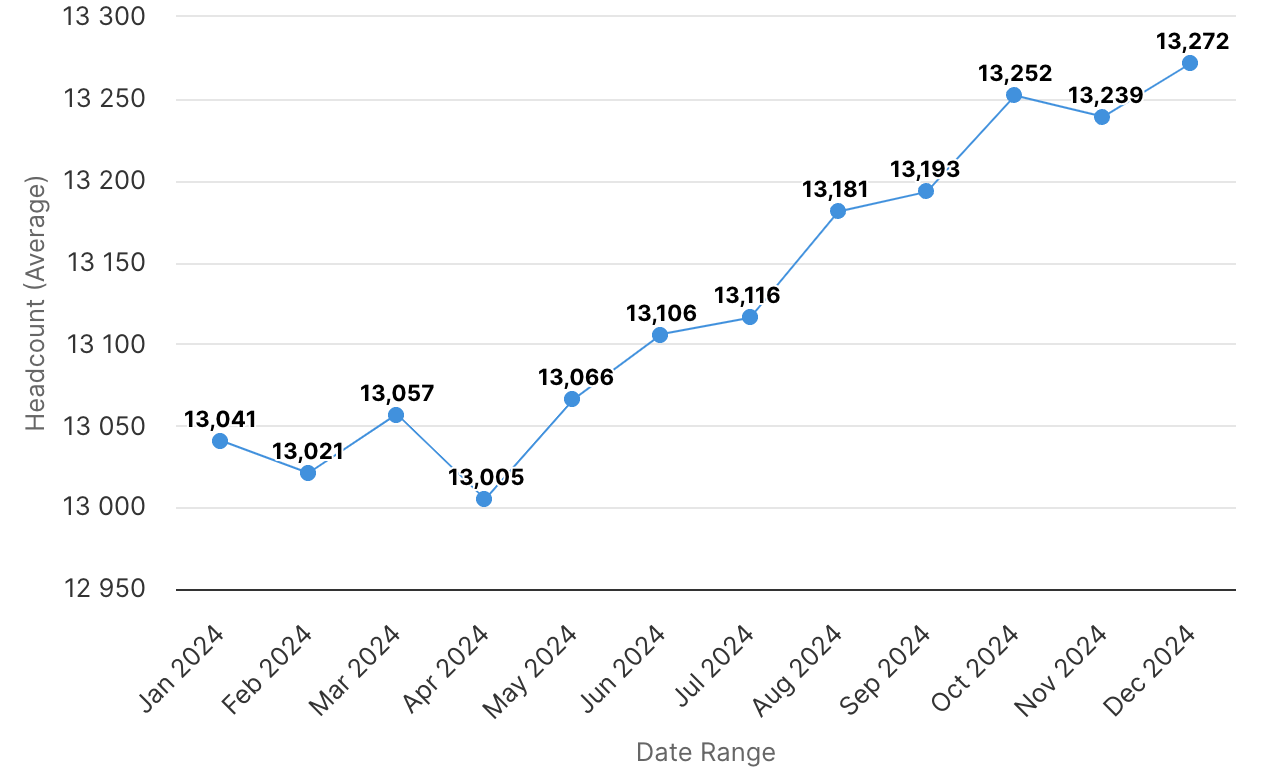
Line
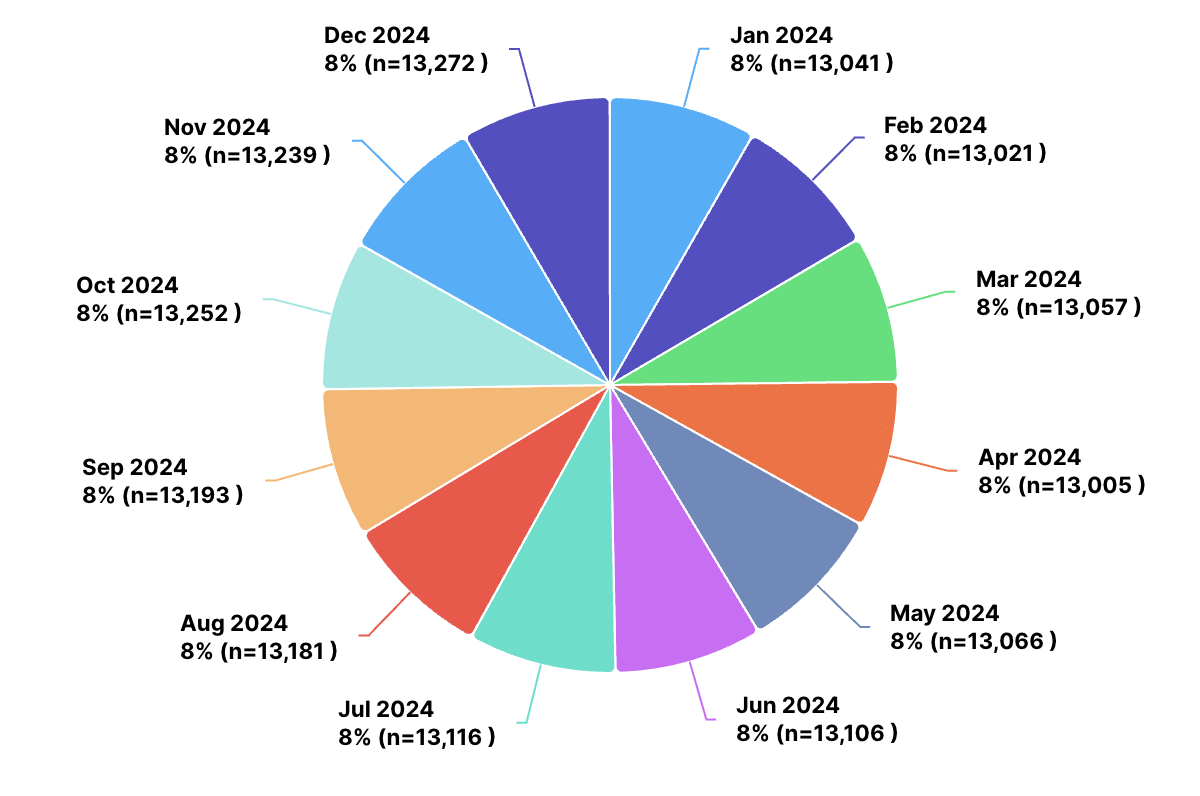
Pie
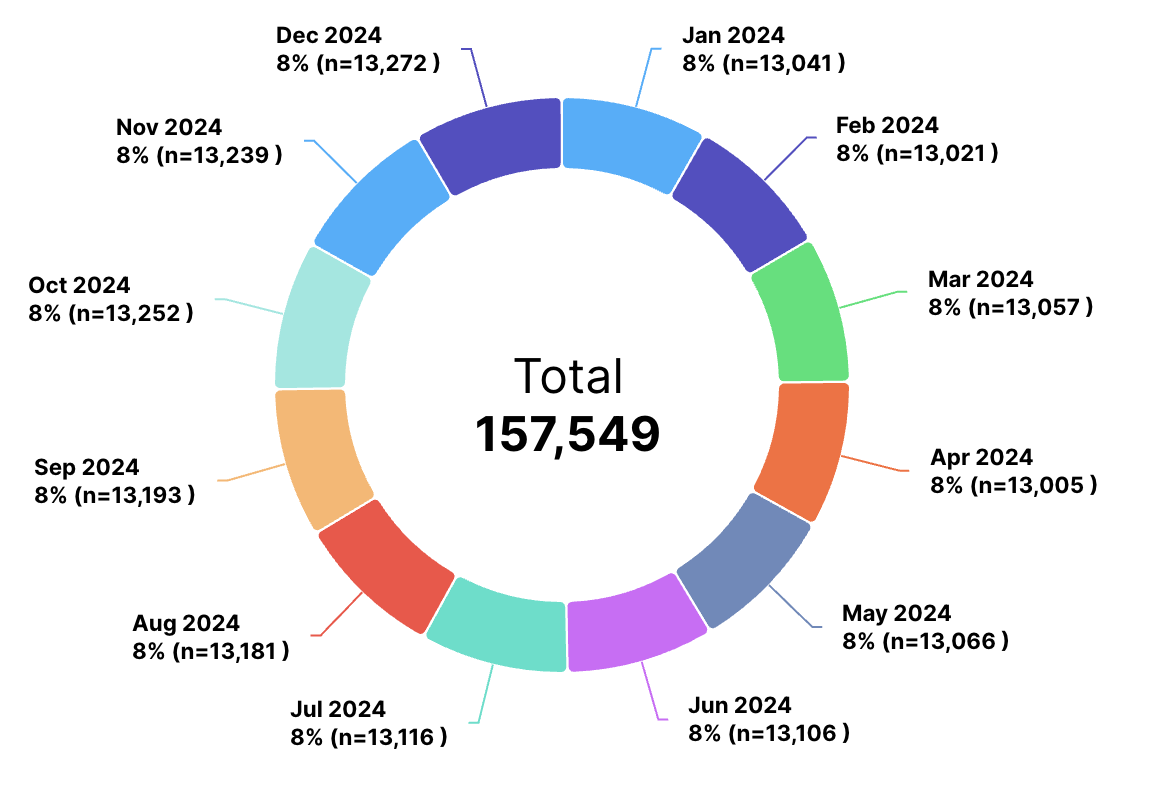
Donut
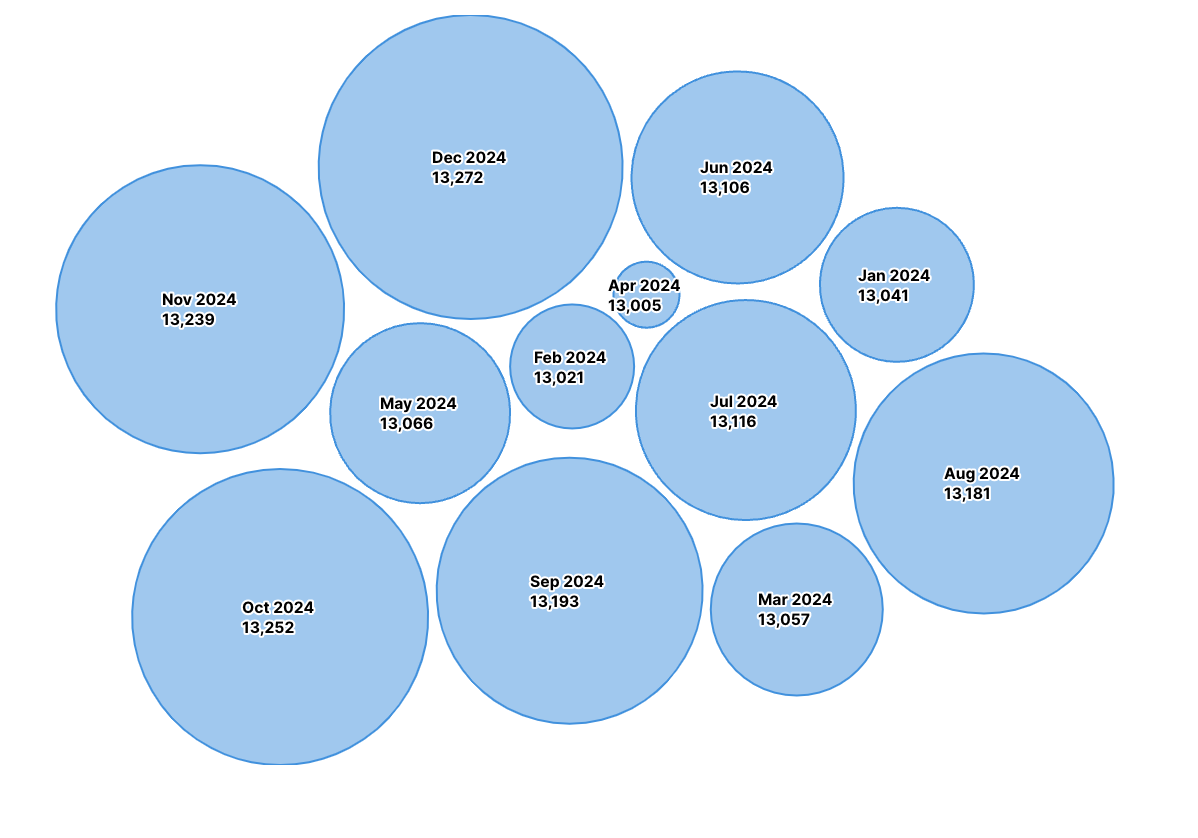
Bubble
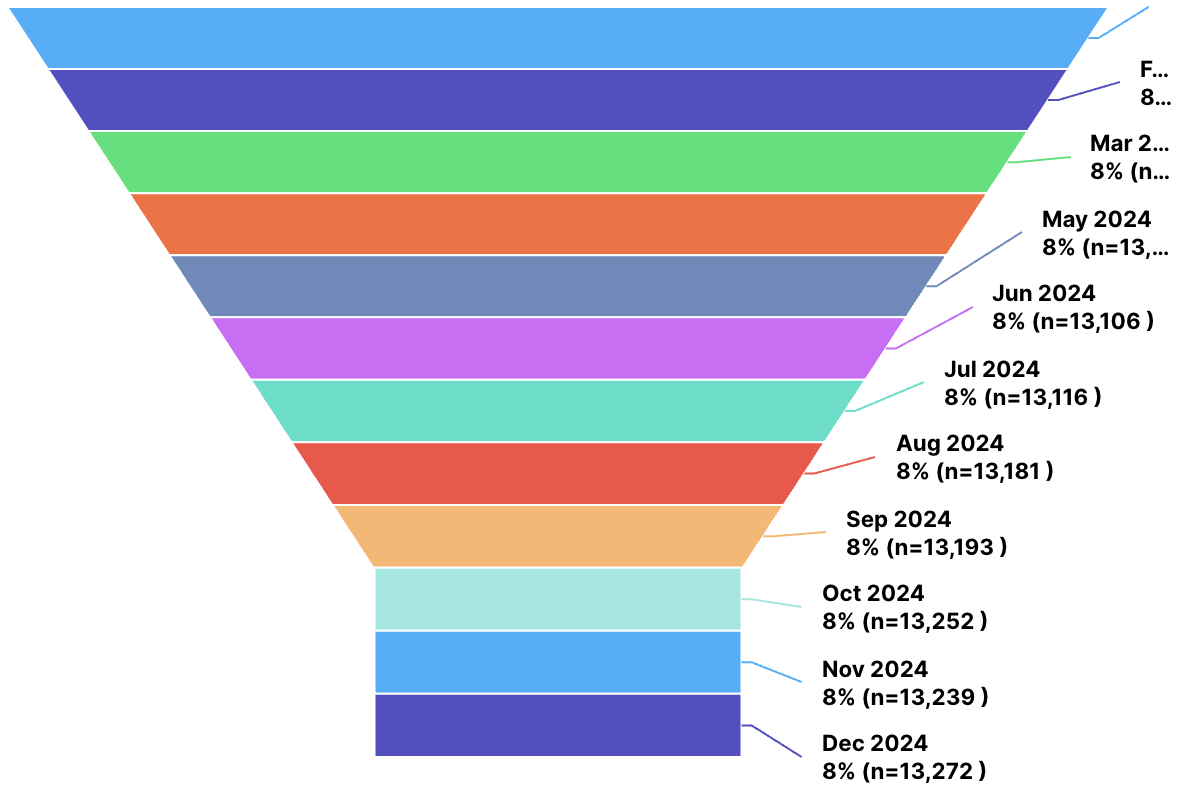
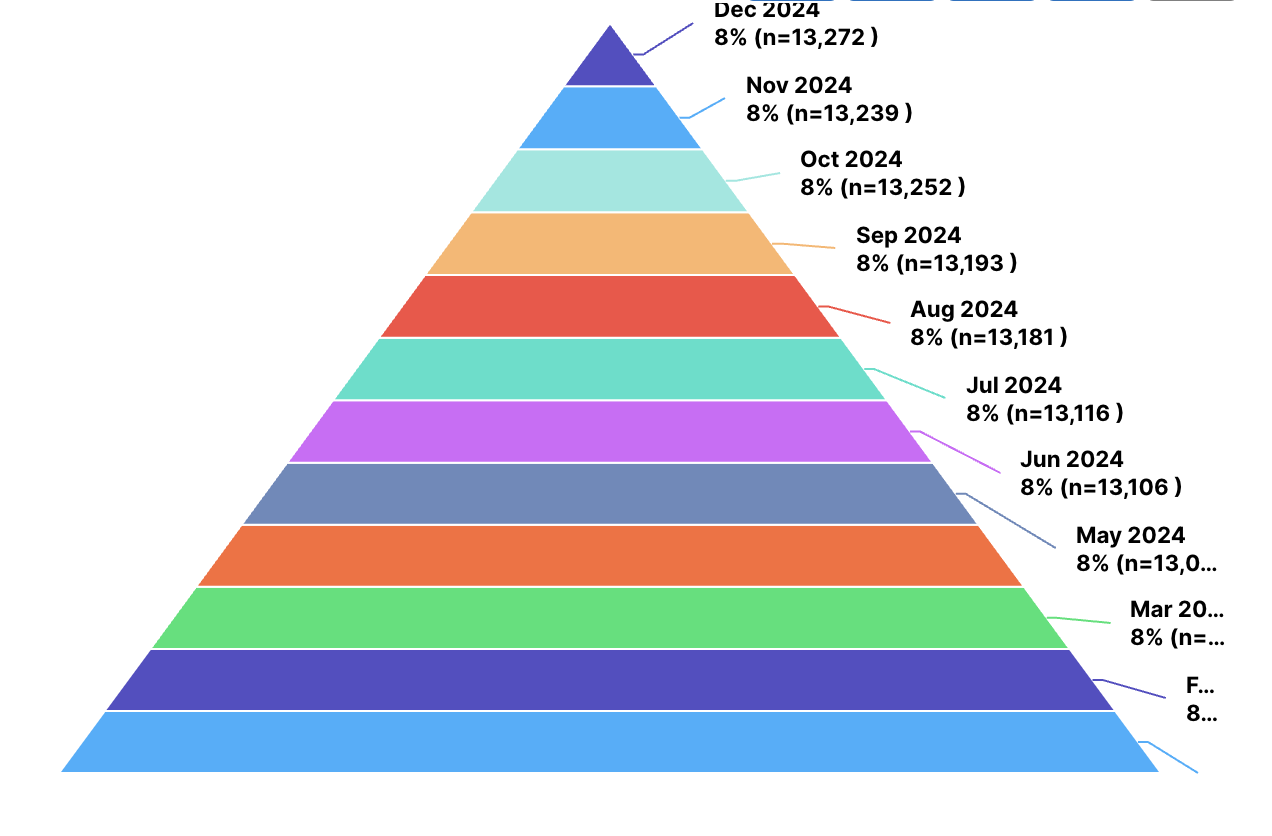
Funnel
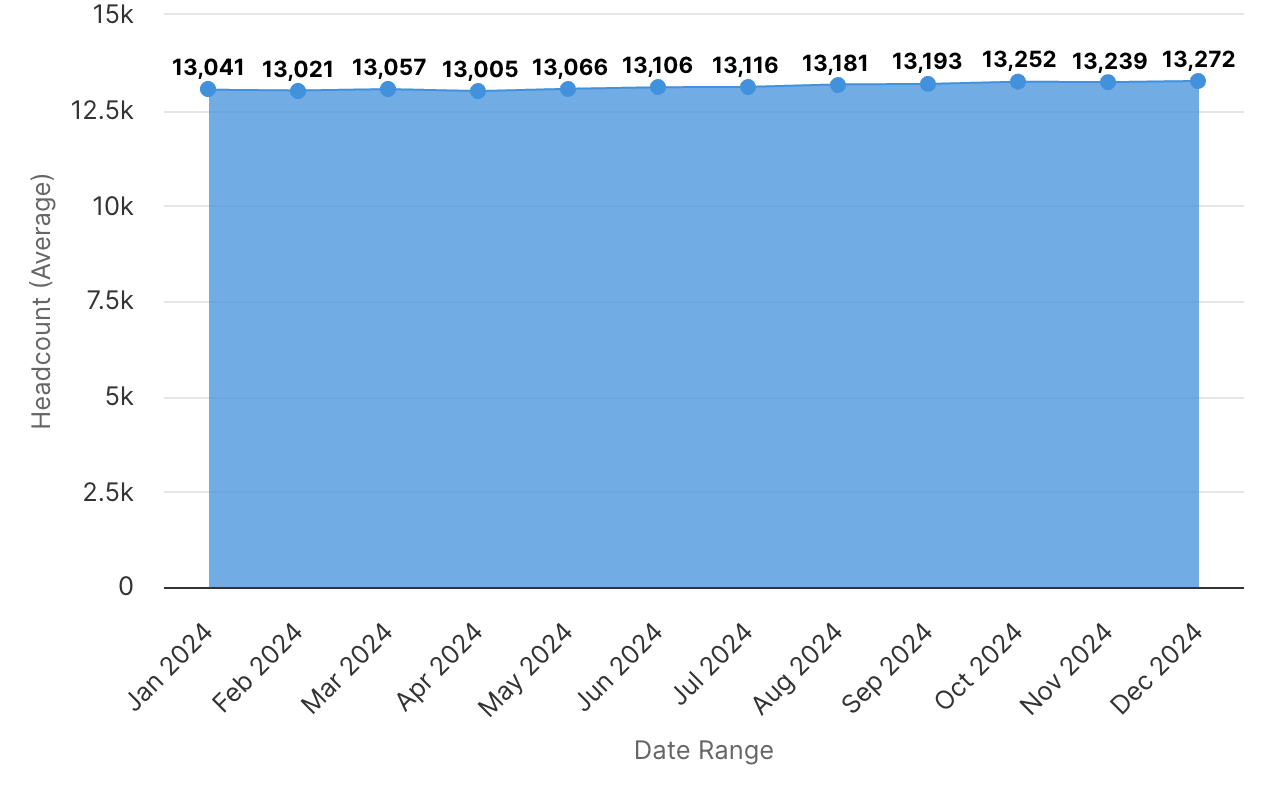
Area
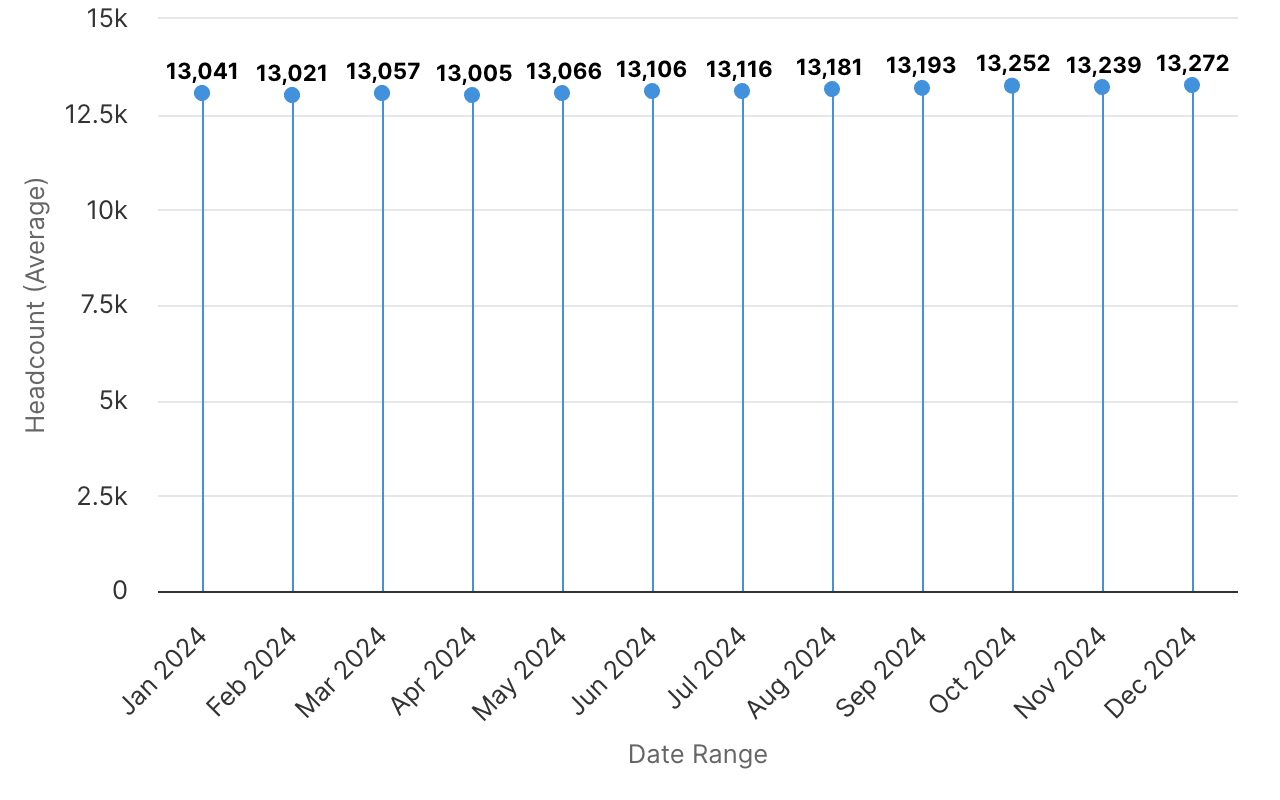
Lollipop
Pyramid
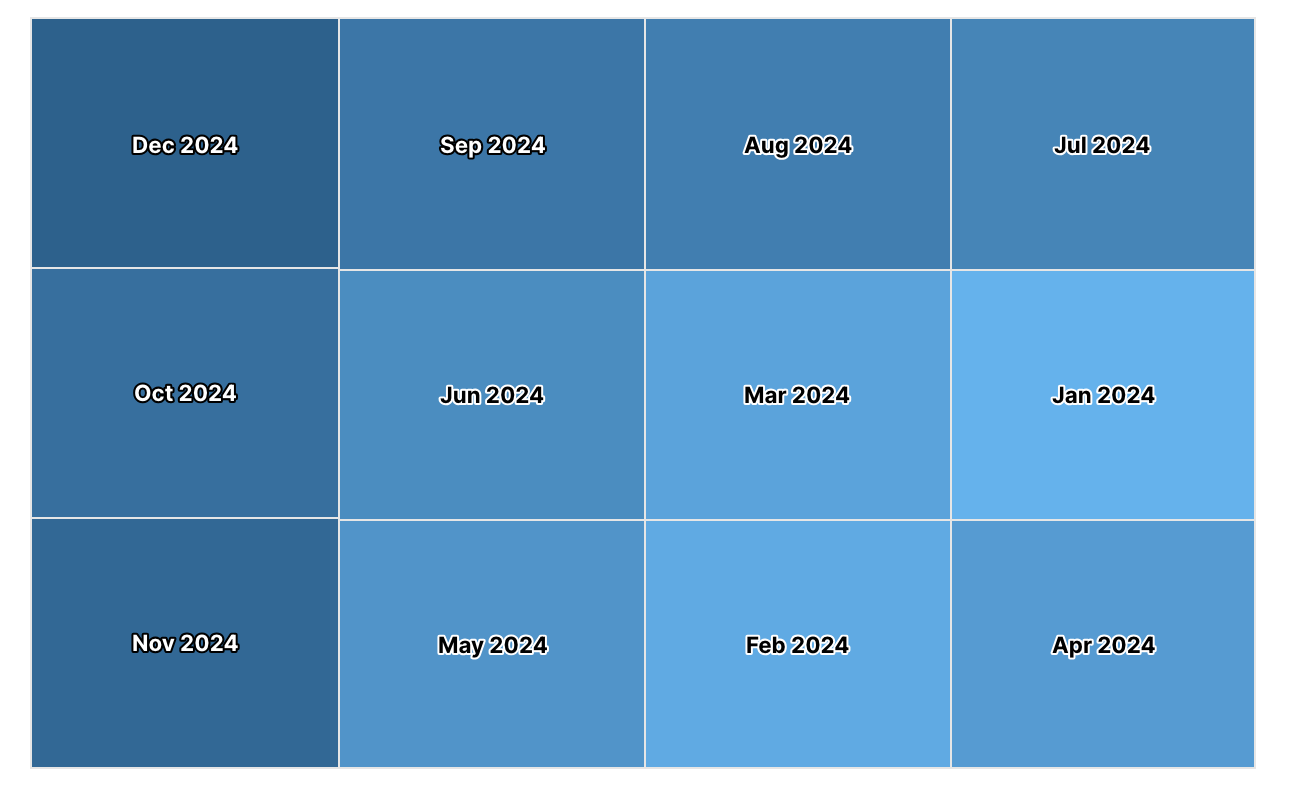
Heat Map
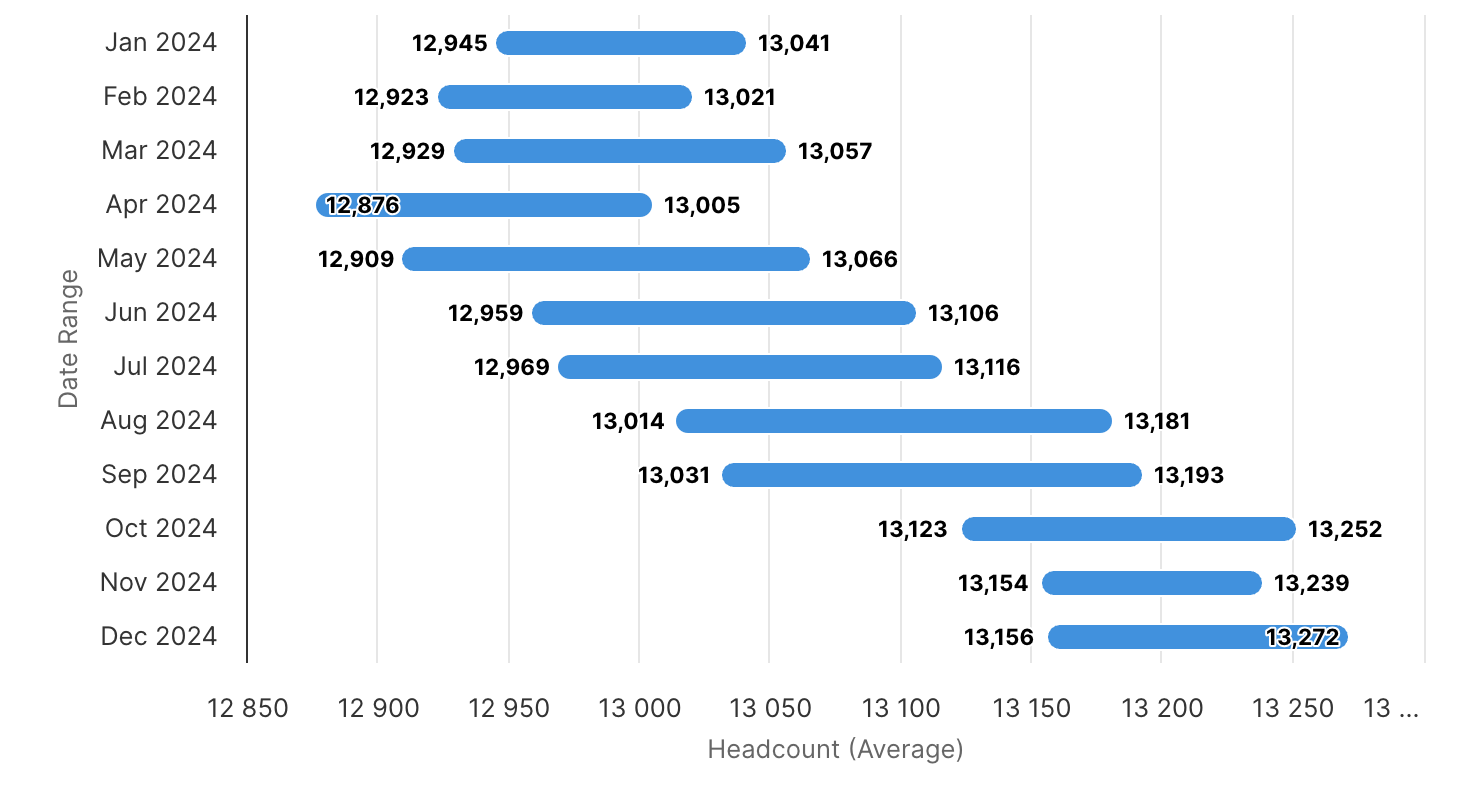
Column Range
For multi-series charts (multiple key measures), the available options include: