AI * Generated Insights
Each graph on the Discover page includes an option to generate AI-powered insights based on the displayed data. This feature helps identify key takeaways from your data and provides recommendations to optimize performance. To access these insights, first expand the available questions, then click the “AI Insights” button in the top-right corner of the graph.

This will generate key observations and potential actions related to the data. The AI uses a secure language model that does not pull from external sources, ensuring data privacy.
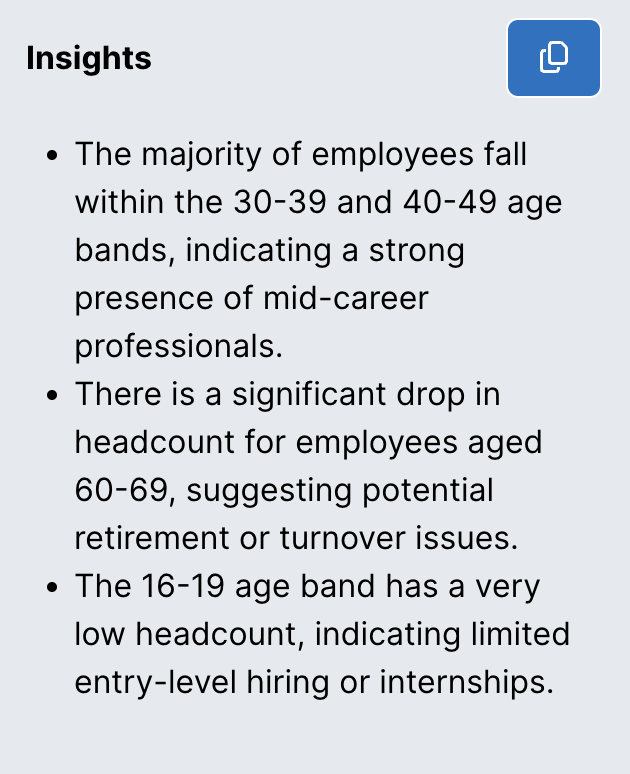
The insights will identify significant trends in the graph, such as spikes, drops, high points, and low points.
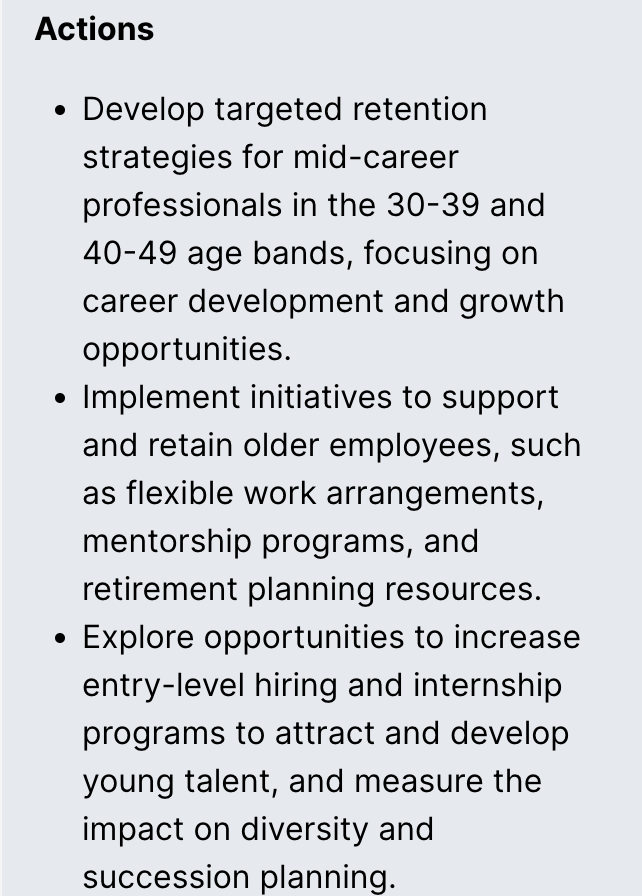
Below the insights, you’ll find suggested actions tailored to the graph’s content, providing strategies to improve outcomes.
AI Insights are also available for charts in the Explore page. To access them, click the lightbulb icon in the top-right corner of the chart to open the Insights menu.

Then, select “AI Insights” from the menu to generate insights and suggested actions.